
Visualize
Turn Complex Data into
Clear Insight
Customizable dashboards, dynamic reports, and unified profiles deliver real-time, actionable views for leaders, teams, and organizations.
See More.
Understand Faster.
Dashboards, Reports, and Profiles turn data into clear, interactive views that drive faster, more informed decisions across every level of your organization.
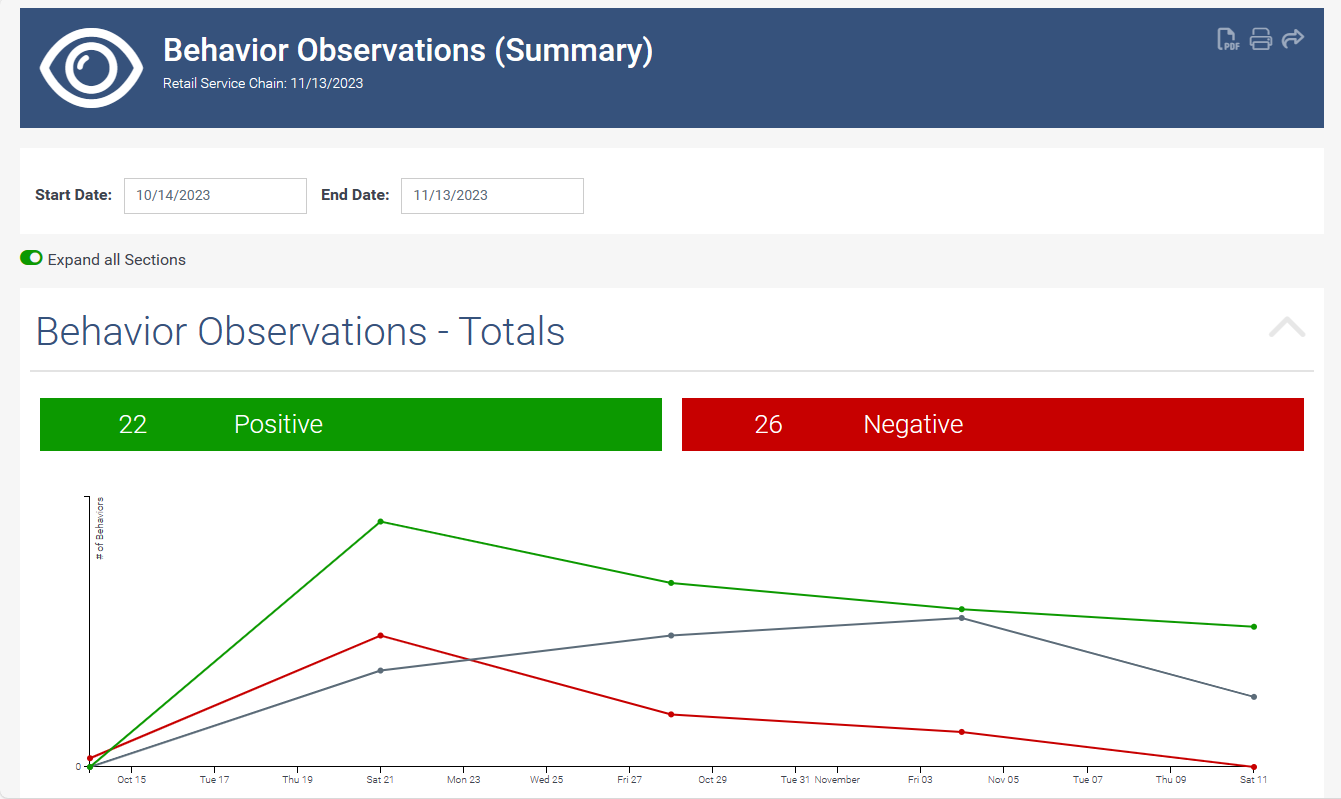
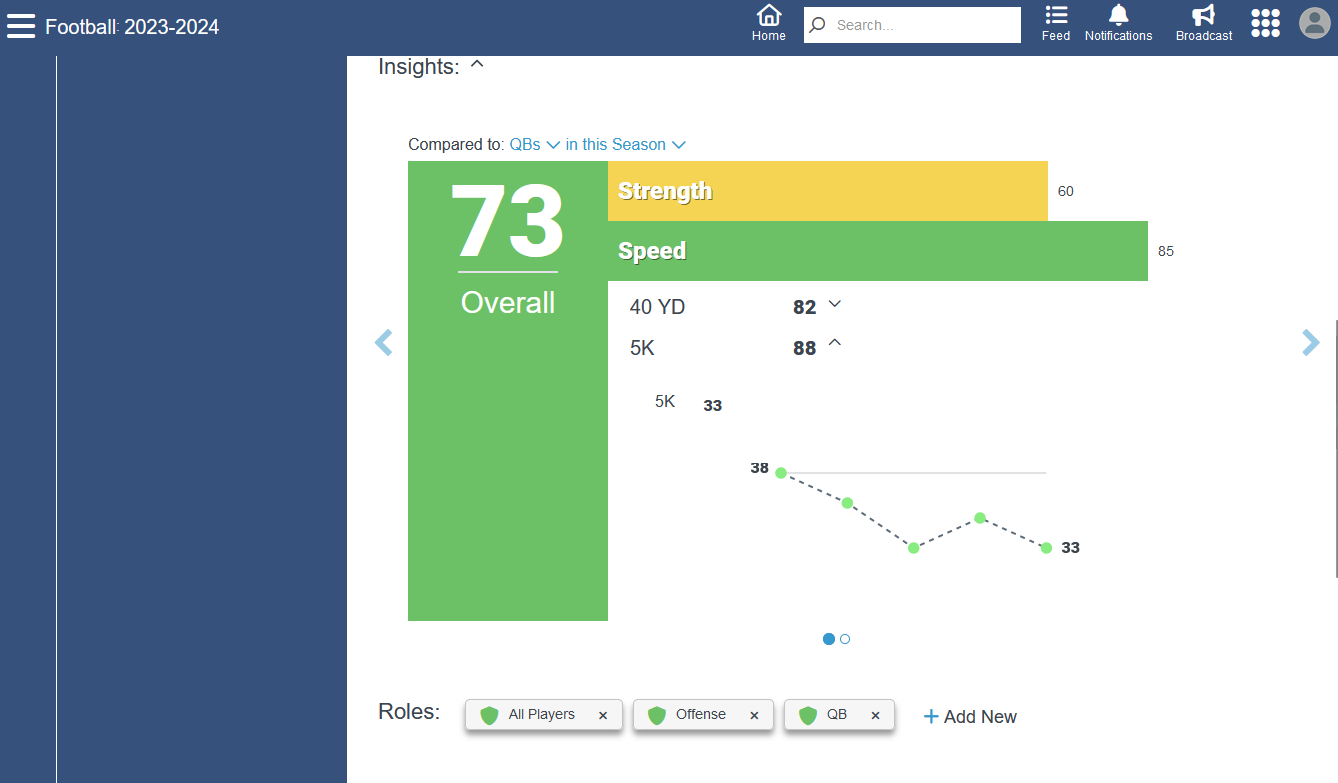
Dashboards
Interactive Data at a Glance
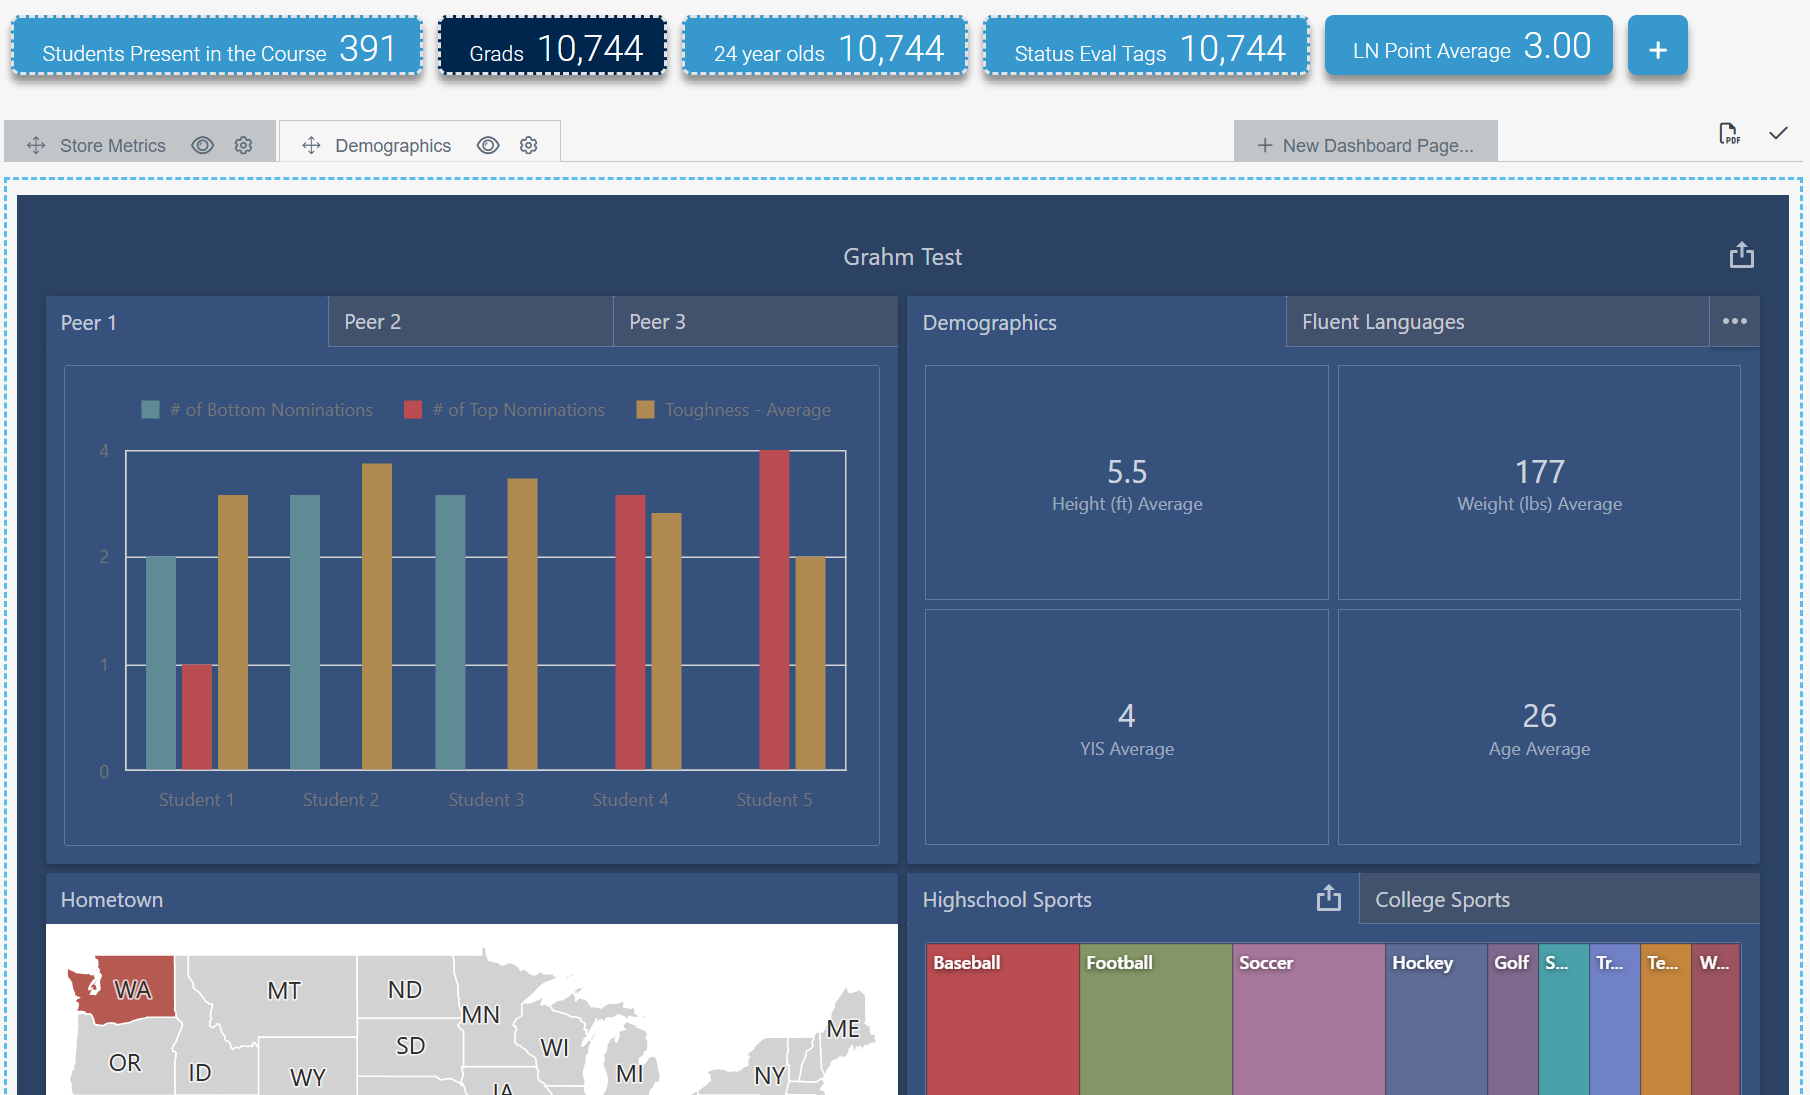
Brandable, Real Time Dashboards
Design and deploy fully branded dashboards using GideonSoft’s built-in reporting tools, or integrate seamlessly with platforms like Power BI and DevExpress. Quickly surface real-time metrics on individuals, teams, and locations to drive fast, evidence-based decisions.
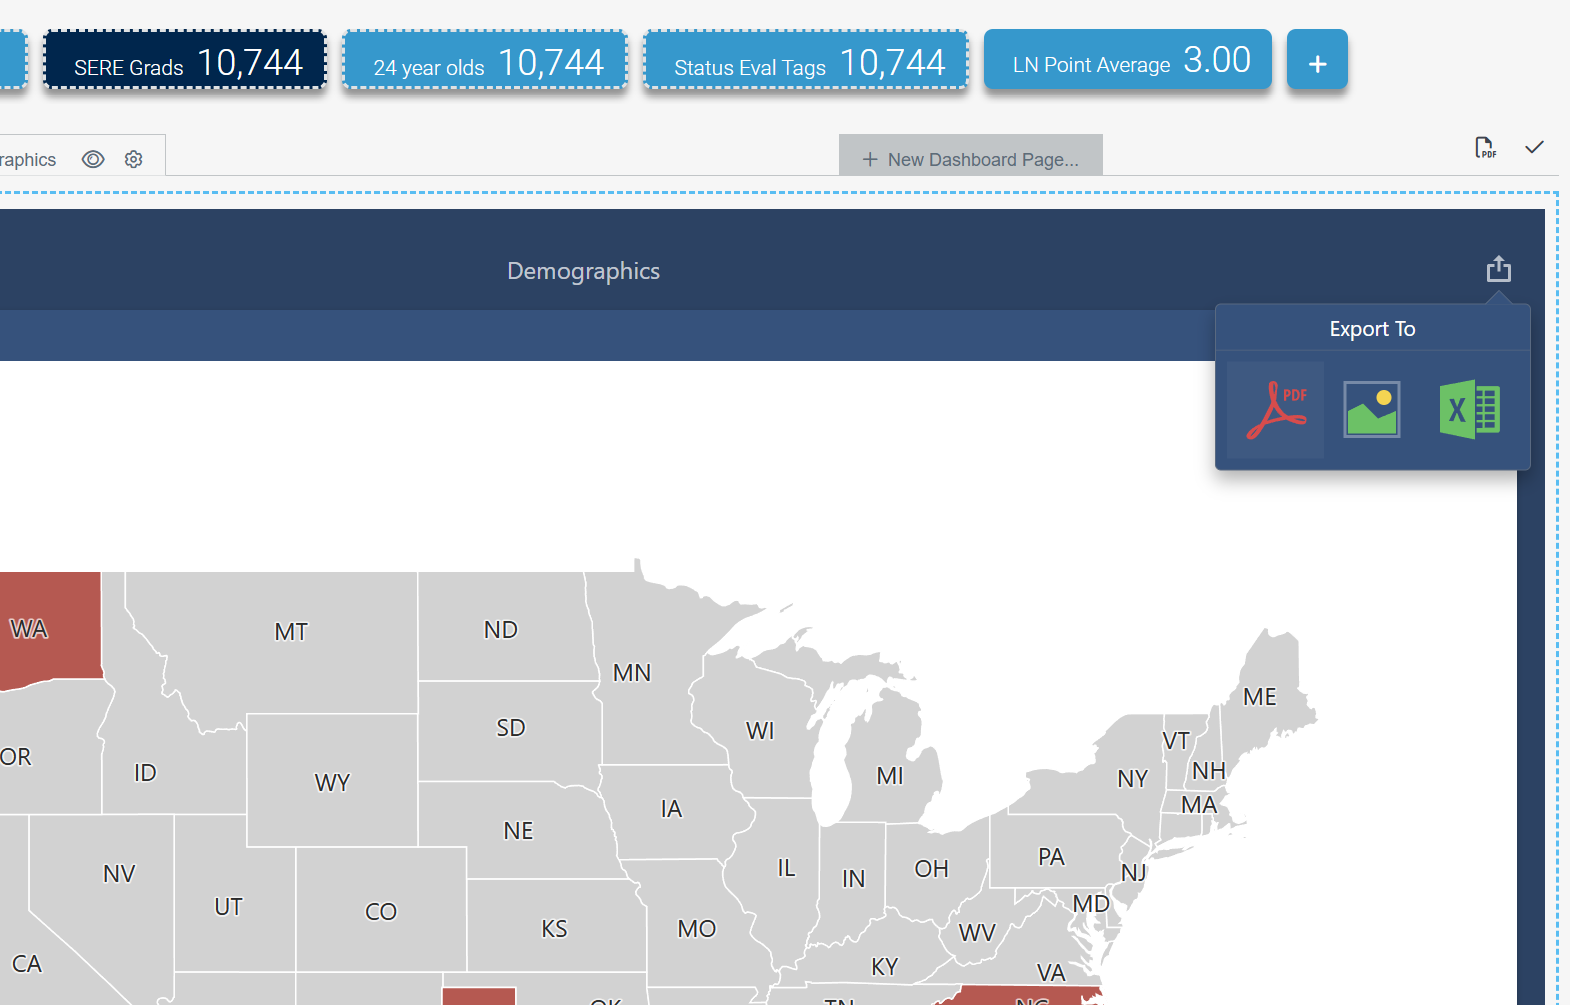
Flexible Export Options
Export dashboards in multiple formats, including PDF for reports, images for presentations, or CSV files for deeper analysis. This ensures insights can move fluidly between operational use and executive review.
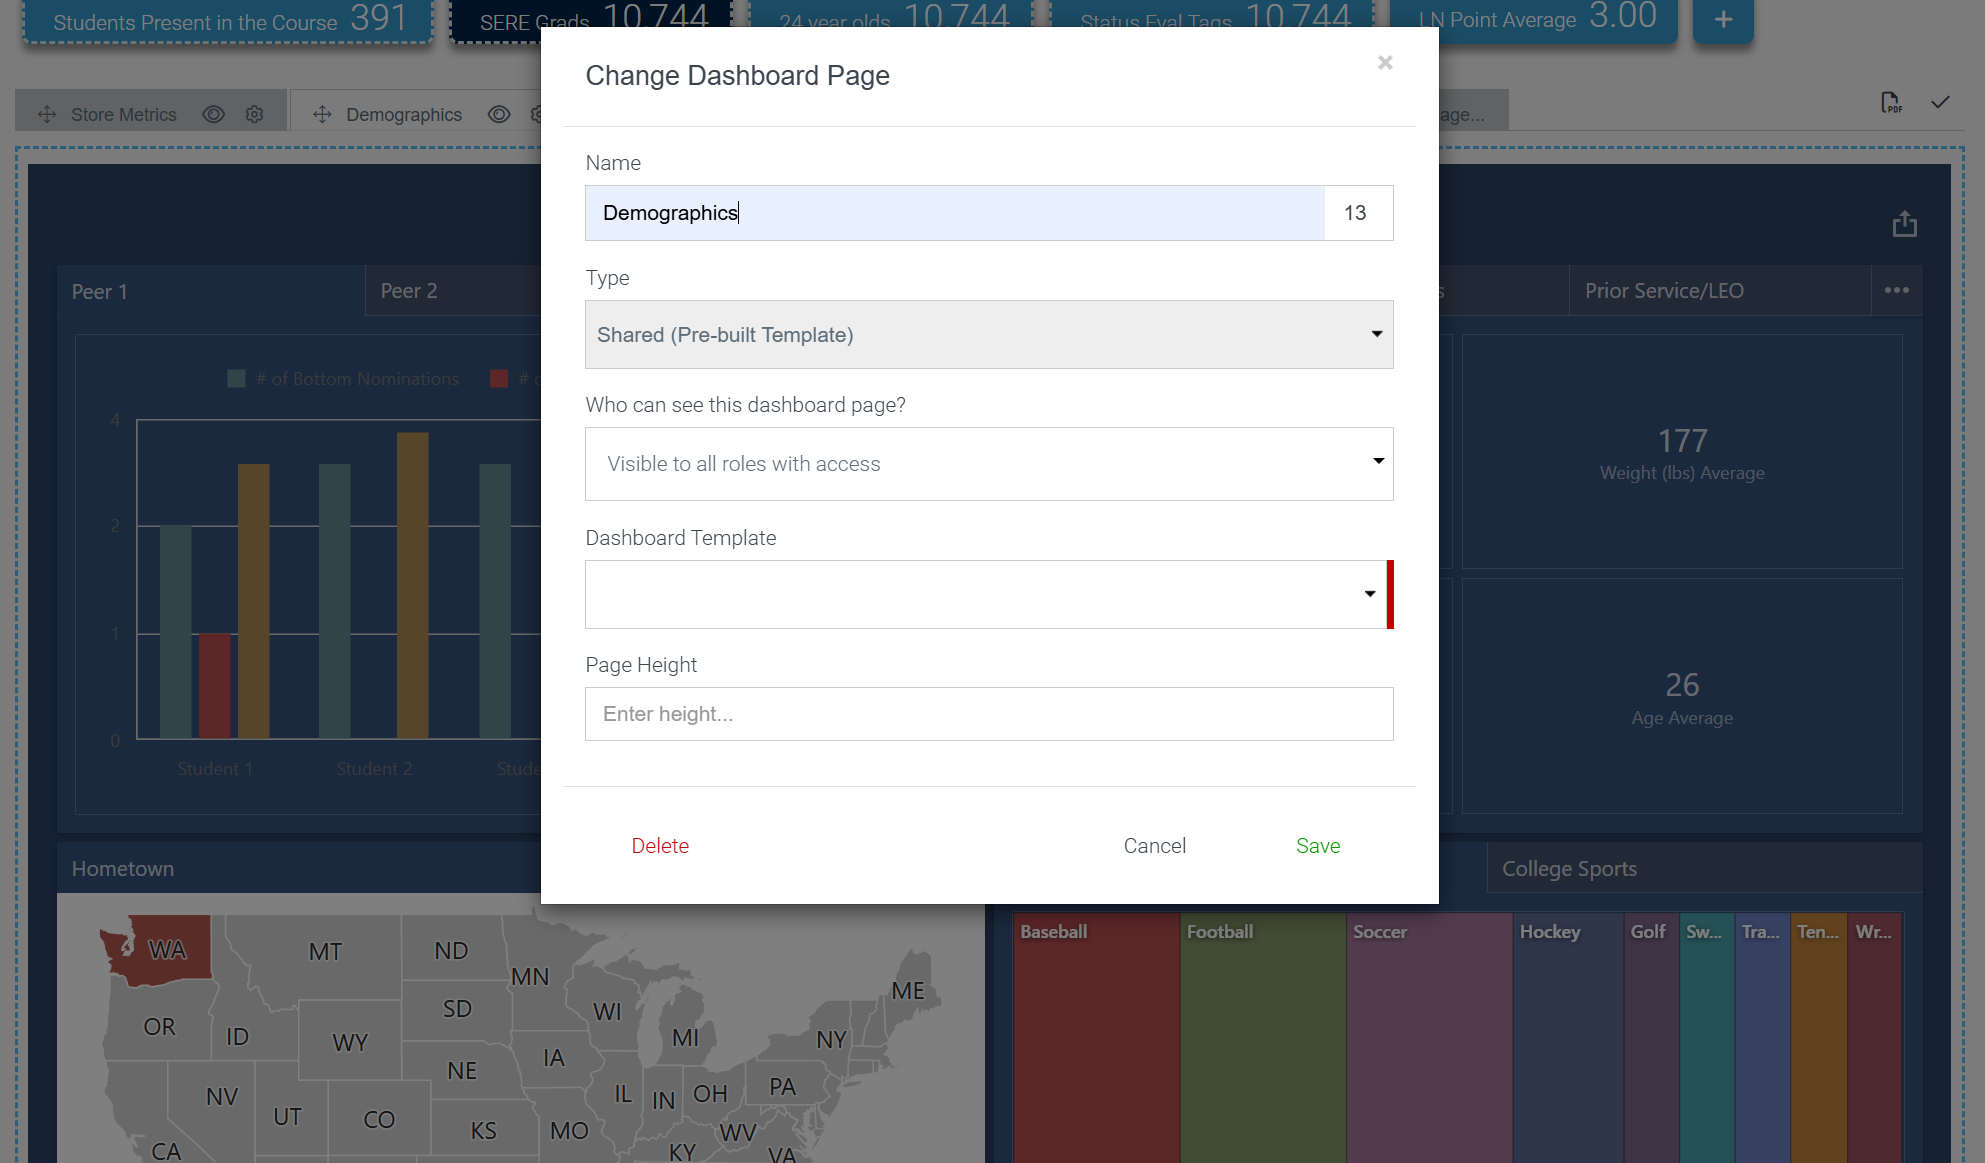
Customizable Permissions & Templates
Assign role-based permissions to control what each user can see, ensuring secure and tailored access across the organization. Import and export reusable dashboard templates to maintain consistency and scalability across teams and departments.
Reports
Dynamic, Data Driven Deliverables
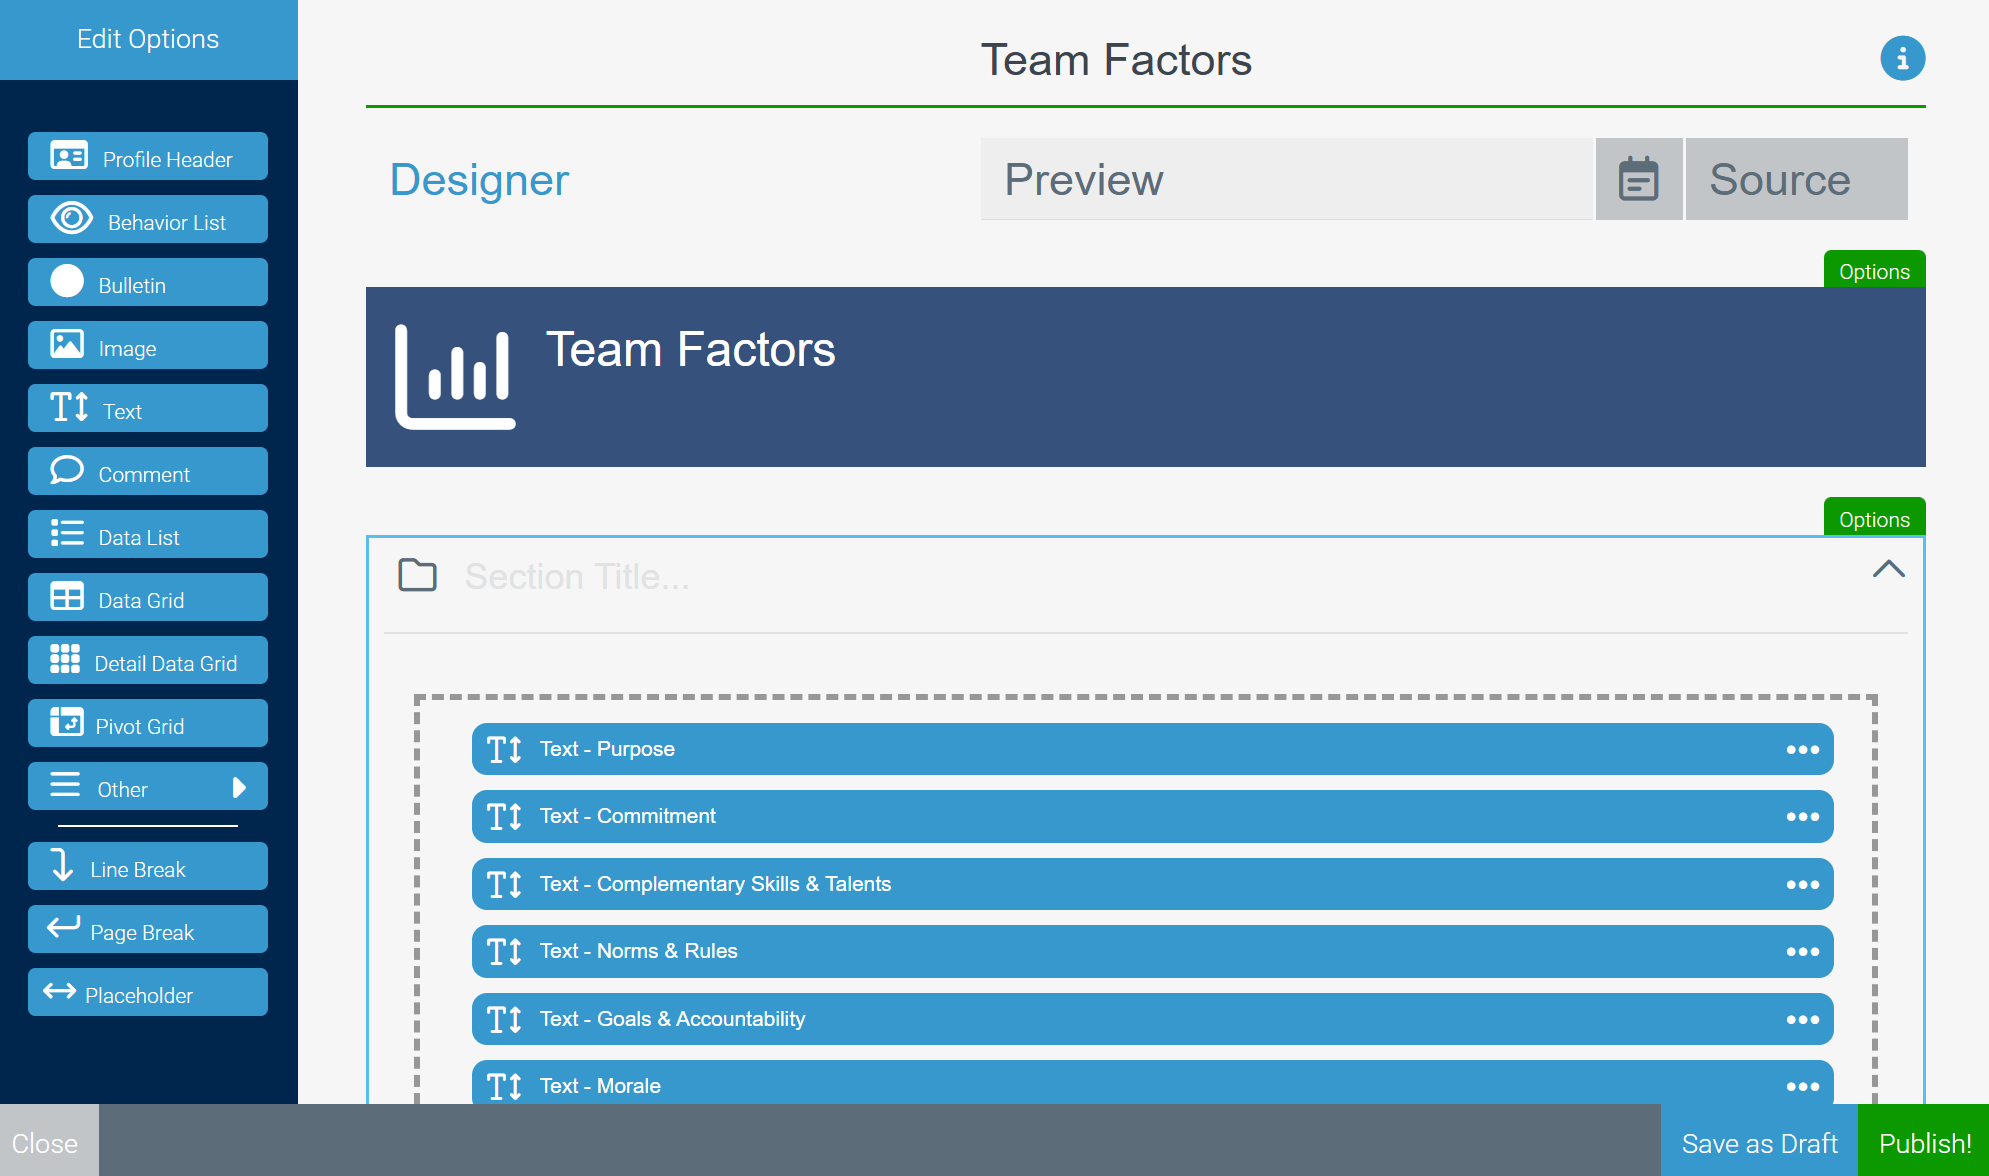
Advanced Custom Report Design
Build reports that combine multiple data sources, including surveys, observations, events, and performance metrics into visually dynamic outputs. Choose from a wide library of visualizations including bar charts, pie charts, liquid fills, gauges, 3-point scales, histograms, decision trees, and 360° grids.
Rich Content & Data Elements
Go beyond charts with advanced report elements: behavior lists, images, text narratives, and comments. Power users can leverage data lists, data grids, detailed data grids, and pivot grids to build reports that blend human feedback with advanced statistical structures. Enhance every report with AI generated insights, leveraging world leading AI models to summarize trends, highlight risks, and suggest next step actions.
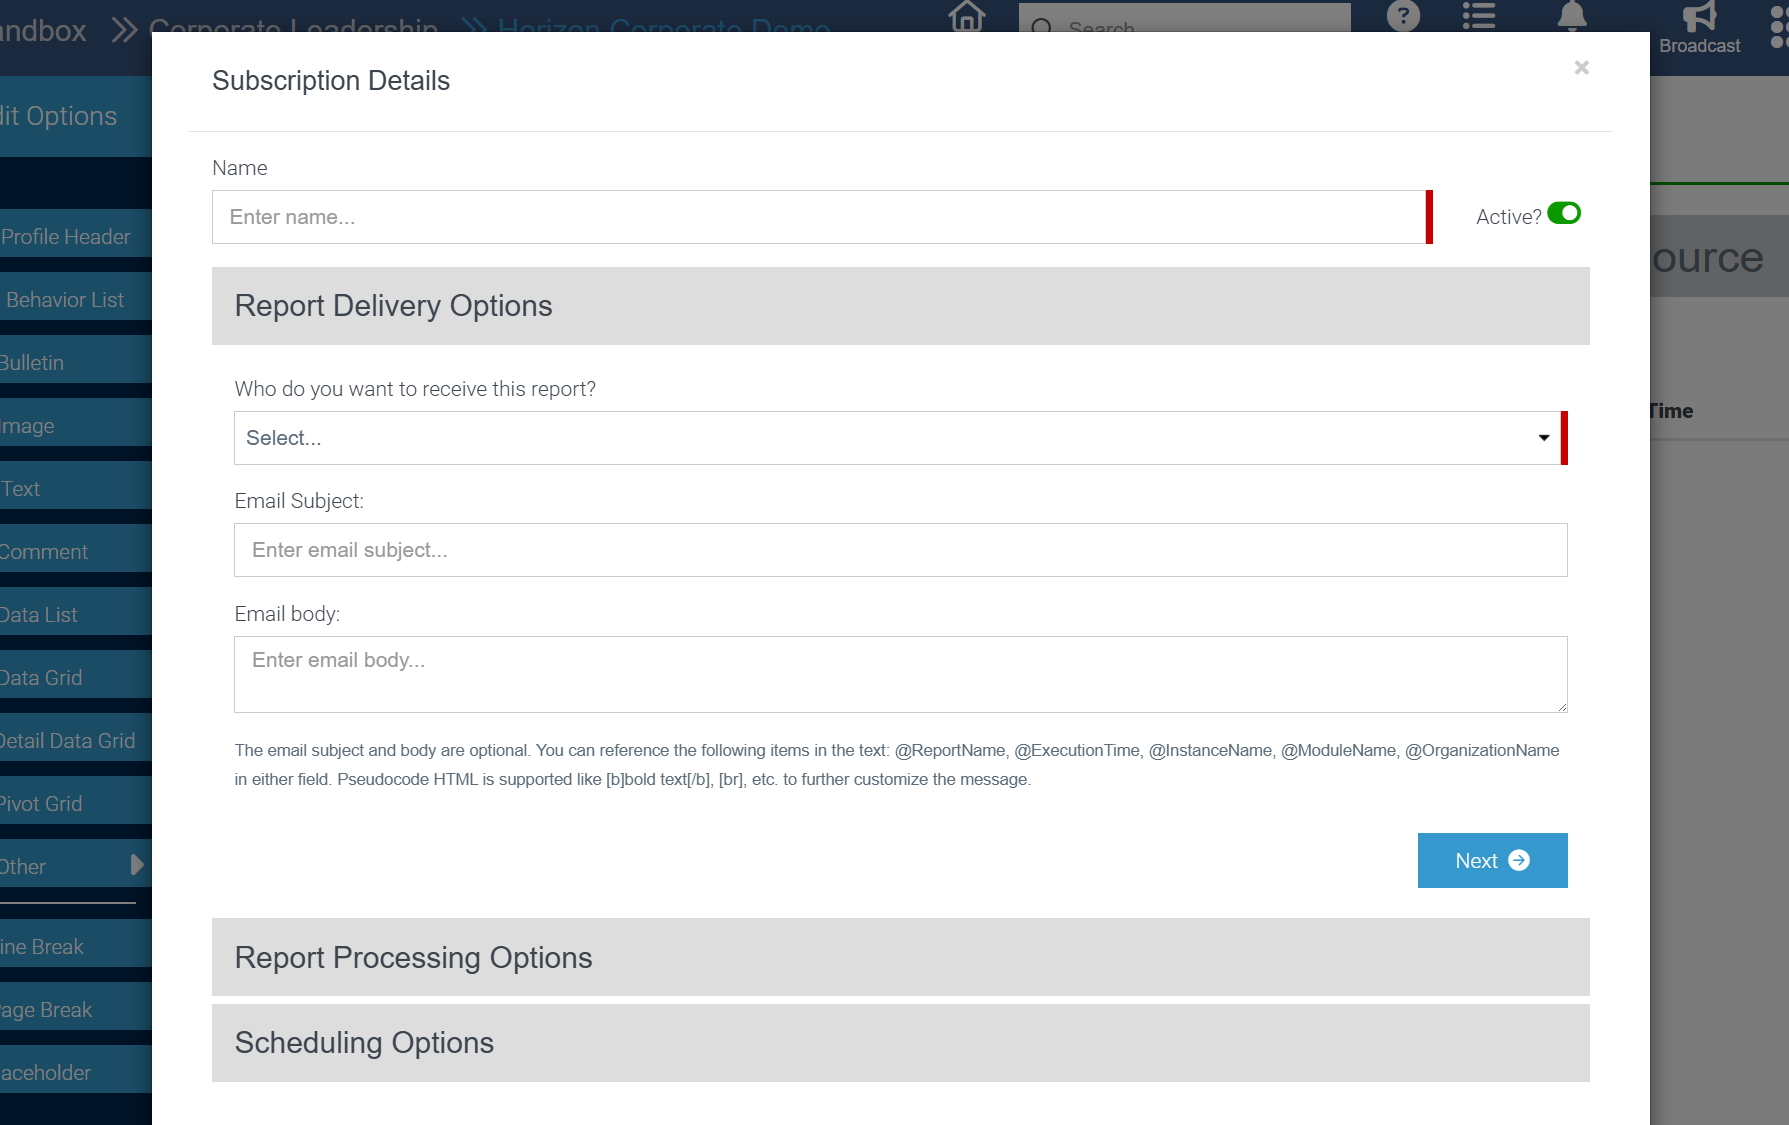
Flexible Distribution
Distribute reports as interactive web views, PDF exports, or secure sharing links. Trigger report generation on demand, on schedule, or upon event completion ensuring that critical insights are always delivered on time and in the right format.
Profiles
Unified Records, Rich Context
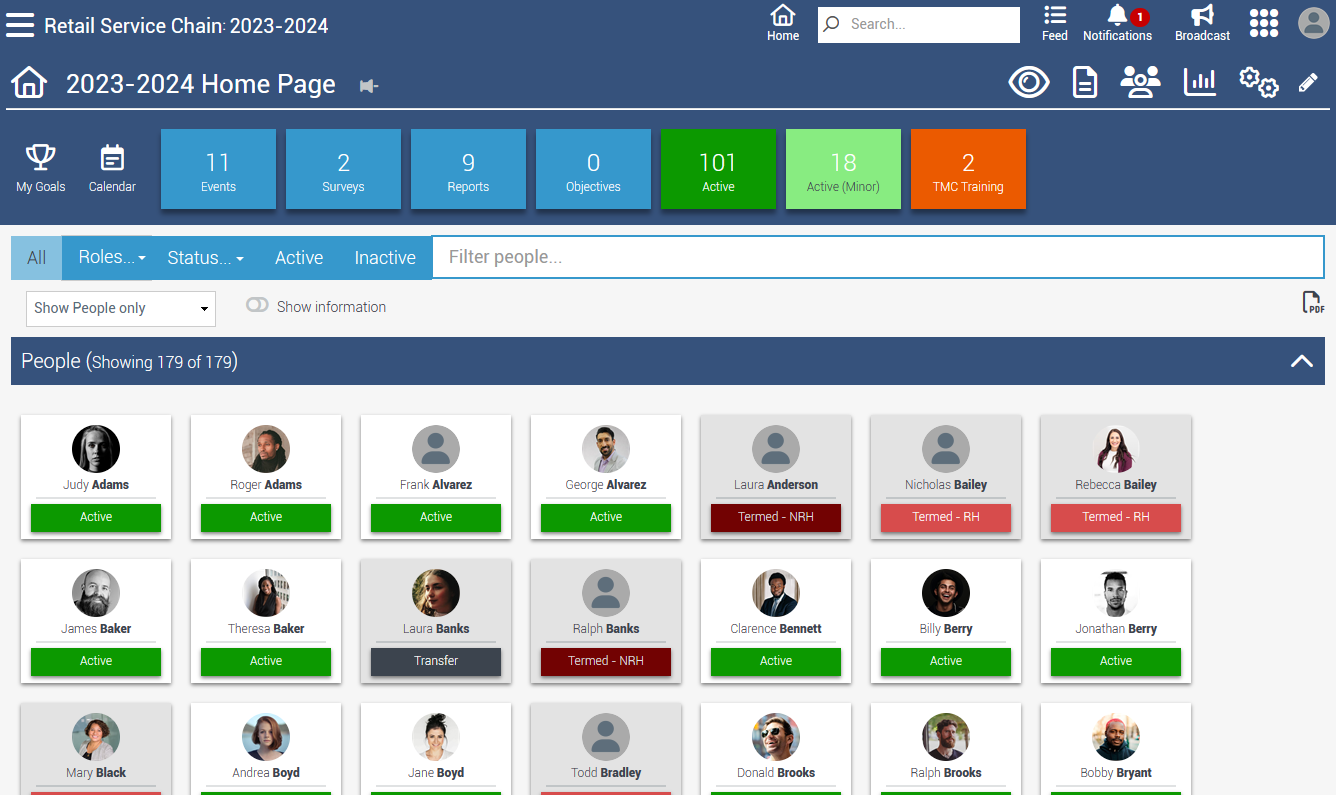
People Grid Overview
Access an organization wide people grid that provides quick visibility into all team members. Pinpoint exactly who you want to evaluate, then dive deeper into individual profiles with a single click.
Rich, Customizable Profiles
Every person has a detailed profile containing demographic fields, position details, role information, certifications, and more. Organizations can also add unlimited custom fields to tailor profiles to specific business needs.
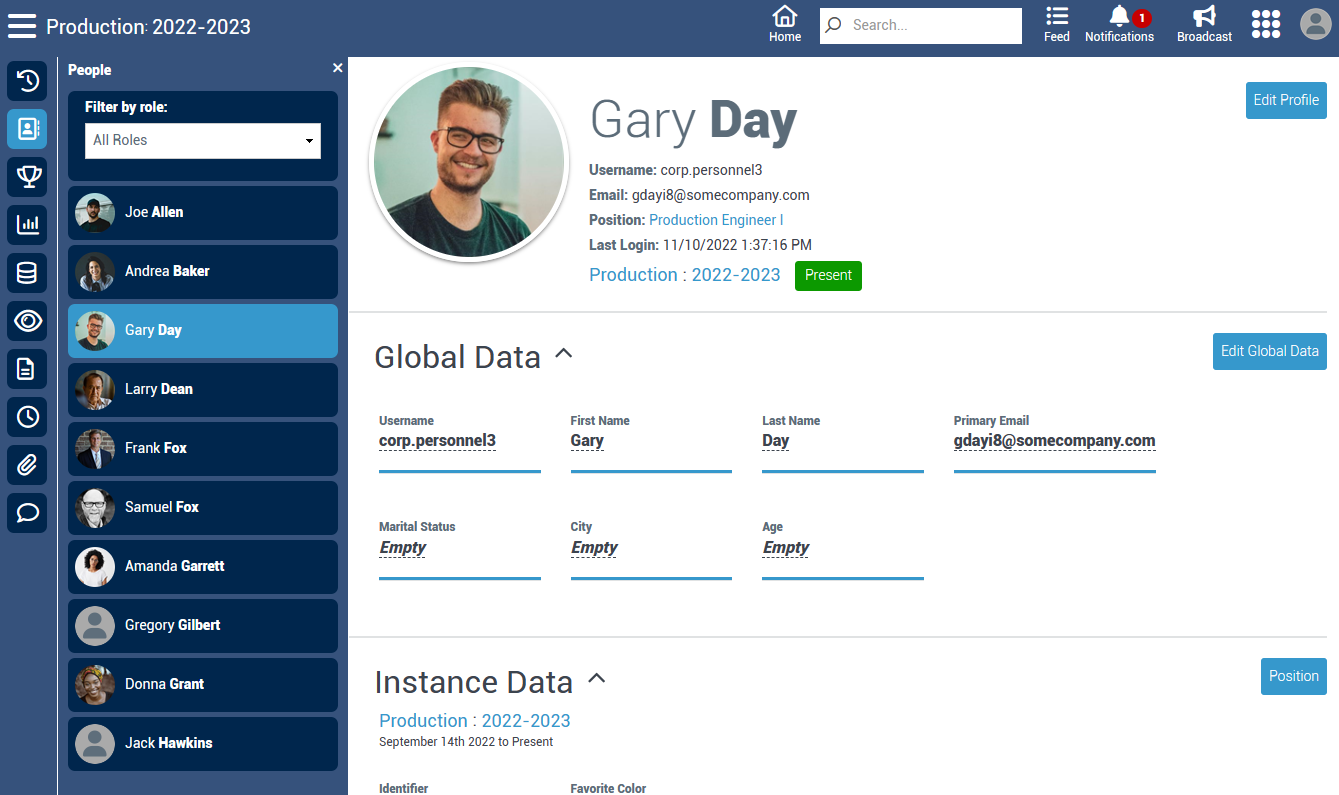
Integrated Performance Records
Profiles link seamlessly to a user’s surveys, reports, attachments, goals, and other records. This creates a unified view of each individual’s performance journey, allowing leaders to connect metrics to people, teams, and organizational outcomes.